John Aleman
All projects

Weather Analytics

A weather dashboard with current conditions, forecasts, trends and year-over-year comparisons for any US ZIP code.

Live
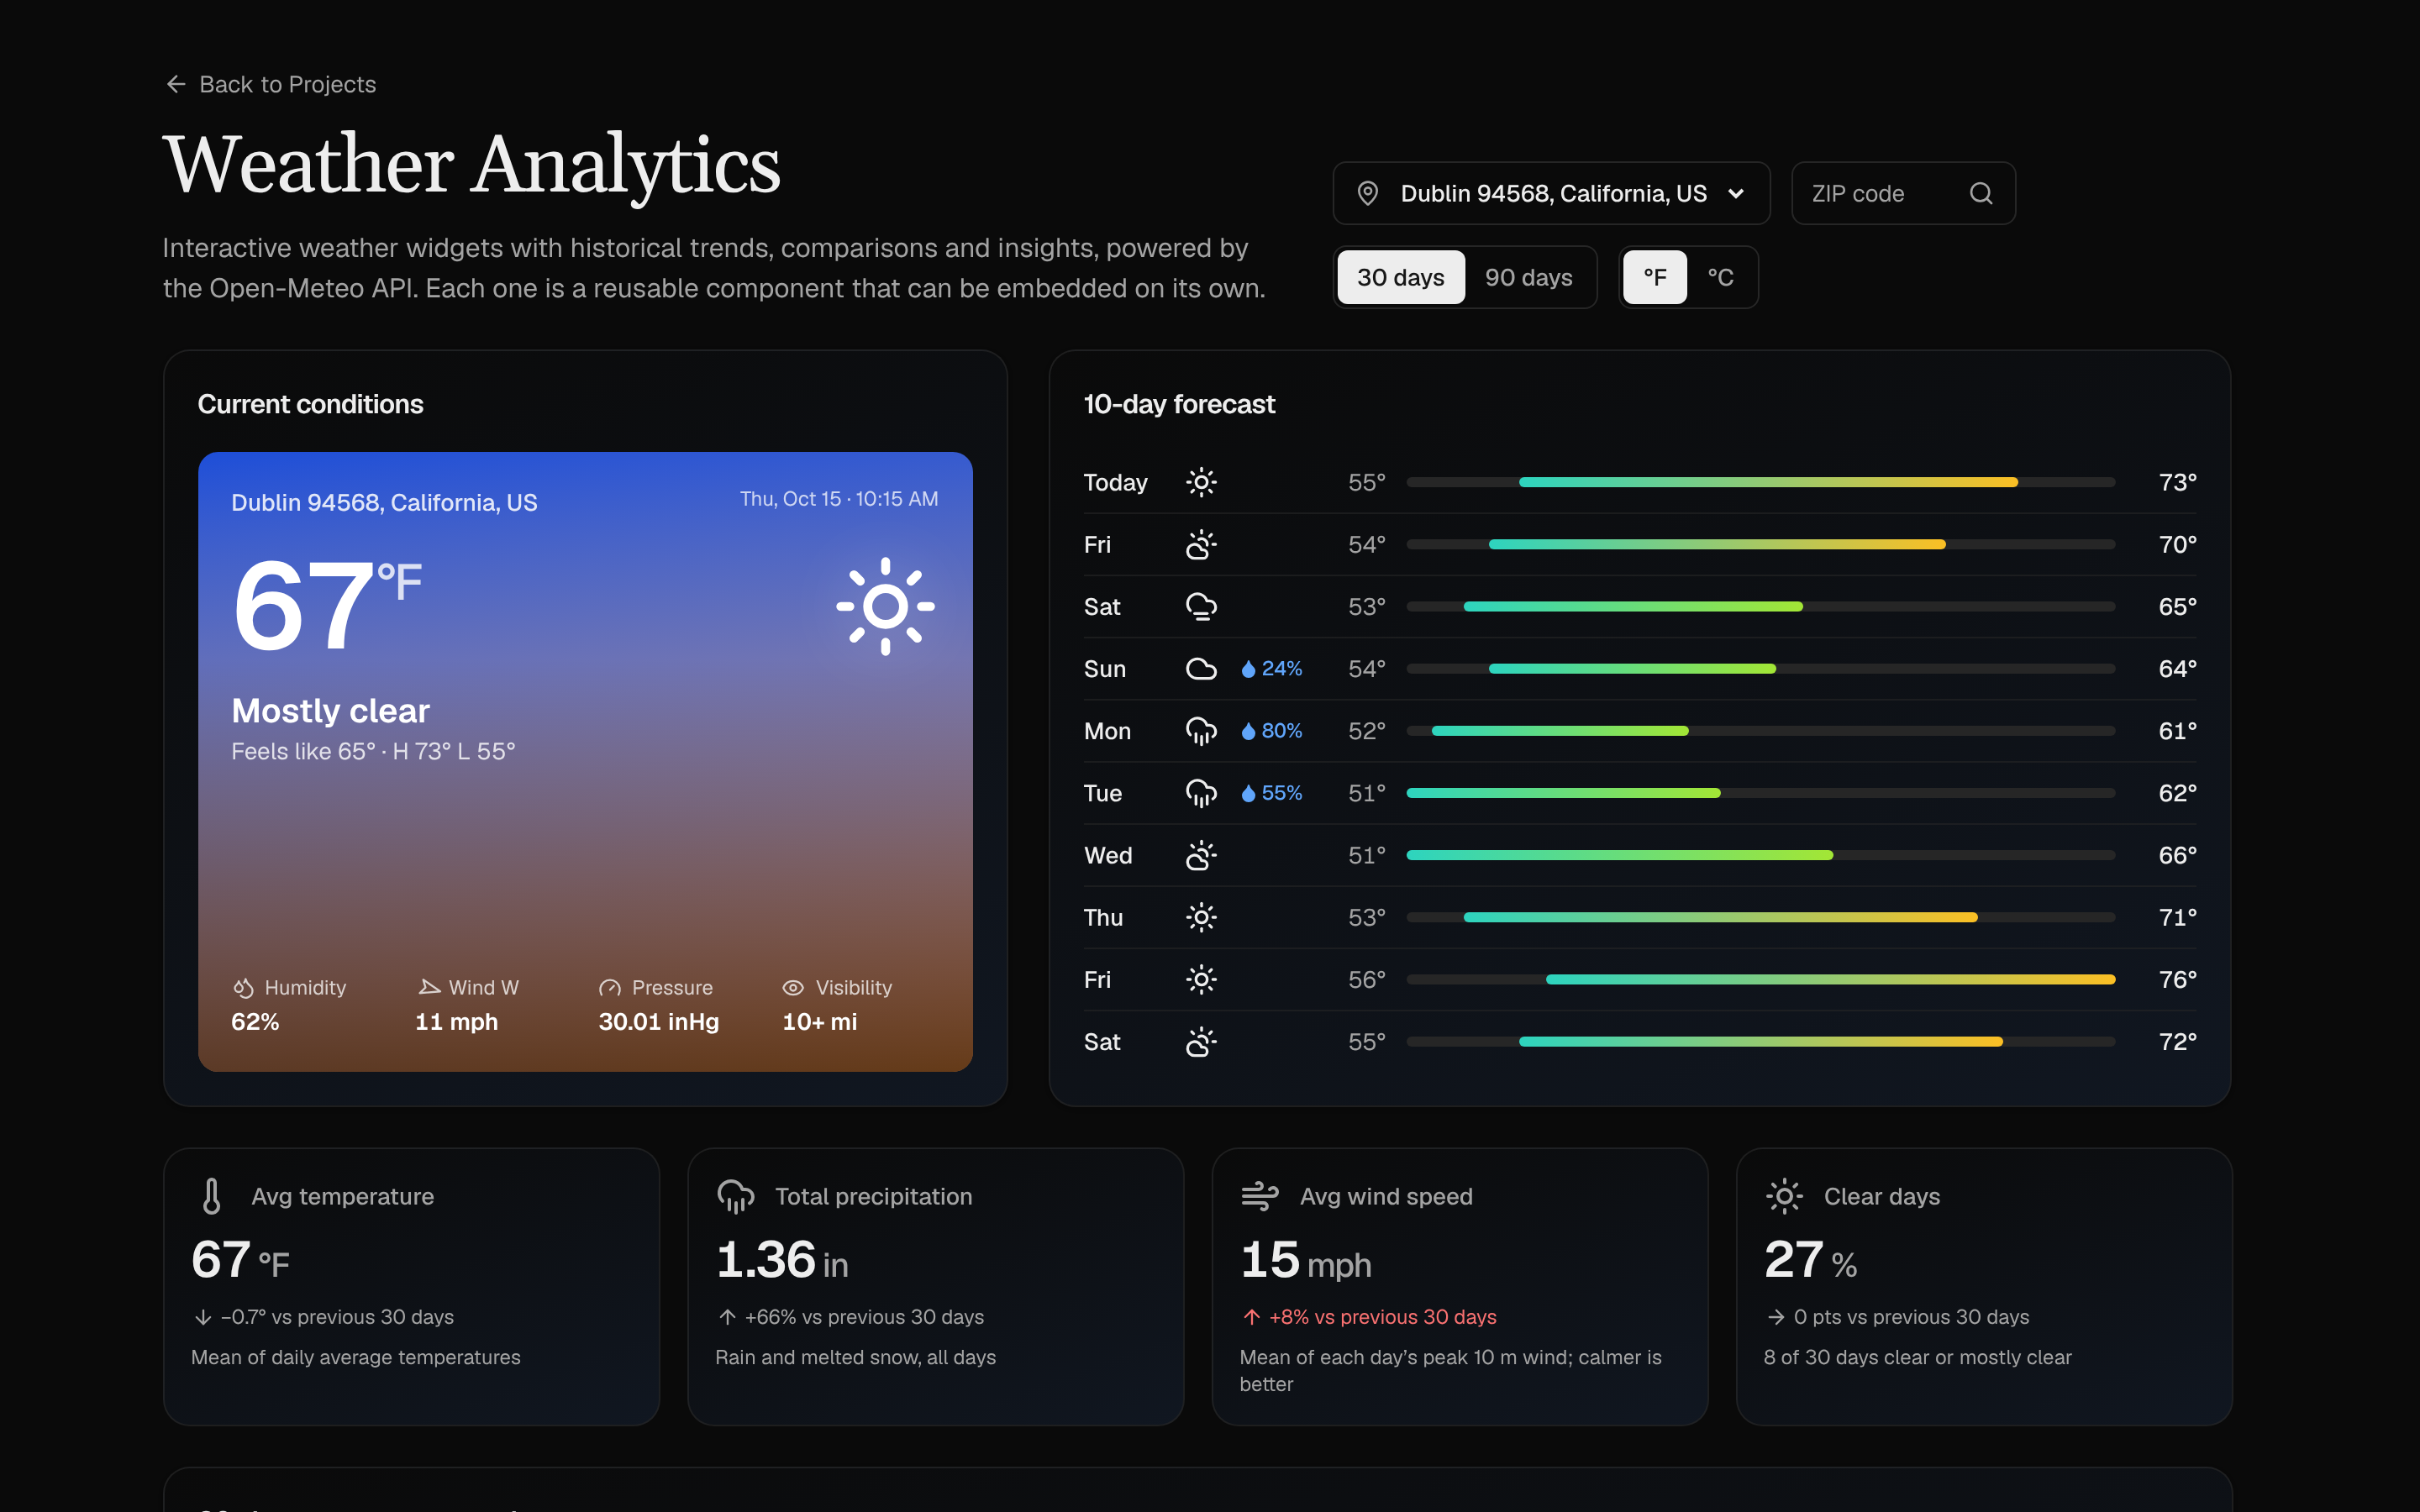
Weather Analytics dashboard showing current conditions for Dublin, California beside a 10-day forecast, above key metrics for temperature, precipitation, wind and clear days
The problem
Forecast apps say what the weather is. They rarely help you judge whether this month is unusual.
Who it’s for
Anyone curious about a place’s recent weather, and engineers interested in streaming dashboards over a rate-limited API.
What I built
Eight reusable widgets, including current conditions, hourly and 10-day forecasts, key metrics, trend charts, a conditions calendar and year-over-year comparisons.
Key decision
Every dataset starts loading on the server at once, and each widget streams in independently behind its own skeleton.

The problem

Back to contents

Comparing this month with the same month in past years needs years of daily history. The free Open-Meteo API has the data but bills requests by their size, and the first design spent its hourly allowance on a handful of locations.

So the real brief was a dashboard that feels instant, keeps working when one data source fails, and stays inside the budget for every visitor.

Product experience

What the product does for the people using it, and why it works that way.

Back to contents
  1. Nothing waits for the slowest chart

    Each widget renders a skeleton shaped like itself and fills in as its data arrives. The same skeletons are used when a widget refetches on the client, so nothing flashes in between.

  2. Changing a view never refetches

    The range, units and selected day are derived from data already loaded. Switching location keeps the old city on screen, dimmed, until the new one arrives.

  3. Every view is a shareable URL

    Selections are written to the URL. A ZIP code is validated and resolved before it is written, so a typo never becomes shared state, and an unknown ZIP is explained without changing the view.

  4. Failures stay small and calm

    A rate-limited or unavailable dataset shows a retryable message inside the affected widget only. Missing days are shown as gaps, never as zeros, and each widget says how many days are missing.

  5. Color is never the only signal

    Trend colors encode meaning (more clear days is an improvement, more wind a decline), and arrows and text carry the direction too. The calendar is keyboard navigable, and the shimmer stops under reduced motion.

Engineering decisions

Each one as the decision, the reasoning, the trade-off accepted and the outcome.

Back to contents

Stream promises, don’t await them

Decision
The page awaits only the location, then hands each dataset to the client as an un-awaited promise. Every widget unwraps its own with use() inside its own Suspense boundary.
Why
Awaiting everything would make the whole page as slow as its slowest request and let one failure blank the page.
Trade-off
More boundaries to design, and a server seed is only valid for the exact request it was made for (the place and the comparison length).
Outcome
A dataset that fails on the server resolves to undefined, and only the widgets that use it fetch for themselves on the client.

Design the request budget, not just the cache

Decision
Request only the variables a view needs, and cache past calendar years for a month because they never change. After a 429, stop calling that Open-Meteo API for a while, tracked separately for the forecast, archive and geocoding APIs, so one limit doesn’t take down the whole dashboard.
Why
The provider bills by request size. One wide archive request cost about 70 calls for every new location, enough to exhaust the hourly allowance quickly.
Trade-off
More, smaller cache entries to manage. Each server instance remembers its own back-off, so a newly started one can still hit a limit once before it backs off.
Outcome
By the provider’s published formula, a new location now costs about 20 calls instead of 70, and extra comparison years are paid for once a month, shared by every visitor.

No database

Decision
Read-only over Open-Meteo, with the only user state (location, range, units) kept in the URL.
Why
The site runs on serverless functions with no persistent filesystem, and a copy of the provider’s history would go stale.
Trade-off
The cache is per process, so each cold serverless instance pays again. A shared cache would fix that, and the docs leave it as an explicit, unmade deployment decision.
Outcome
Same layering as the rest of the site: an adapter around Open-Meteo’s REST API whose response shapes never leave it, thin GraphQL resolvers and TanStack hooks. The browser gets weather data only through the site’s GraphQL endpoint.

Outcomes and lessons

Back to contents

Shipped

  • Eight widgets, ZIP-code search, imperial and metric units, 30 and 90 day ranges, and 2 to 4 years of comparison.

Validated

  • Unit tests for the adapter, aggregation, leap years, partial months and units. Integration tests run the real GraphQL schema. Playwright checks keyboard use, a rate-limited widget, mobile overflow and an axe audit, all with fixtures rather than live responses.

Known limits and next steps

  • A ZIP code resolves to its city’s coordinates, so several ZIPs in one city show identical data.
  • Open-Meteo’s free tier is non-commercial. A shared cache, or a paid plan, would be needed before any commercial use.

Lessons

  • With a size-billed API, how wide a request is matters as much as how many there are. Writing down what each request costs made the waste visible.
  • Open-Meteo
  • Next.js
  • TanStack Query
  • Recharts